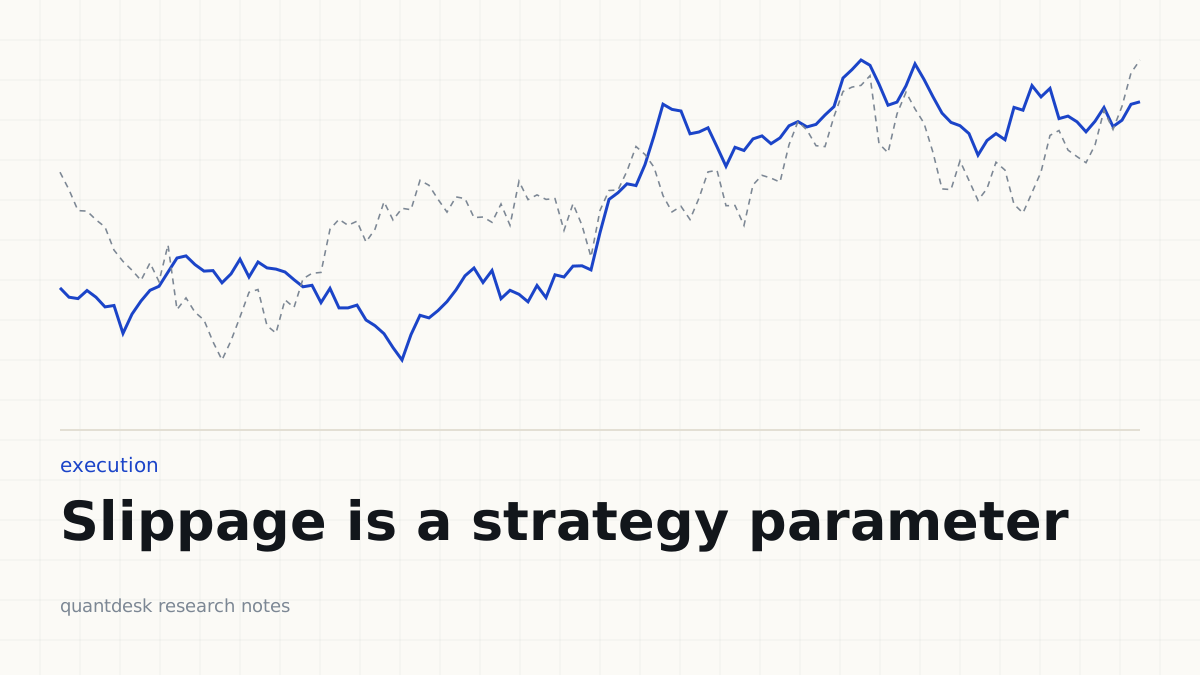
Traders treat slippage as weather: unpleasant, unpredictable, someone else's fault. It is neither unpredictable nor entirely someone else's fault. Measure it and it becomes a parameter, and parameters can be improved.
What to record on every order
- The decision price — the number the strategy saw when it decided
- The order timestamp and the fill timestamp
- The fill price, per leg, per lot
- The spread and depth at decision time
- The path from decision to fill: retries, modifications, partial fills
Two weeks of that data is usually enough to see the shape of the problem.
What the data usually shows
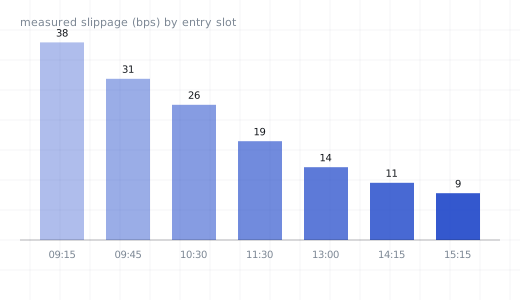
Three patterns recur. The first is a heavy concentration of cost in the opening minutes, where spreads are widest and the strategy is most eager. The second is a systematic cost on exits, because exits are typically market orders taken in a hurry. The third is instrument-specific: the far strike that looked cheap in the backtest has a spread that eats the trade.
Cheap fixes, in order of payoff
- Delay the entry window. Many opening-range systems lose nothing in signal quality by waiting ten minutes, and save a third of their execution cost.
- Limit orders with a defined chase. A limit at the touch, with one modification after a fixed timeout and a market fallback, beats a naked market order in most retail contexts.
- Split the order. Two clips beat one when depth is thin, provided your risk logic can hold a partial position safely.
- Pick the liquid strike. The theoretically ideal strike is not ideal if it costs eighty basis points to enter and exit.
Feed it back into the backtest
The last step is the one people skip: replace the assumed slippage in your test harness with the distribution you measured, per instrument and per time slot. The backtest becomes less flattering and far more useful, and every subsequent decision is made against numbers your own account produced.